(The literature review for this paper can be found in this previous post.)
Study overview
As indicated above, our purpose for this study was to enter the literature on gender differences in game playing with two variations on the extant literature. One of these was to include male and female assessments of game playing gratifications and feature preferences in the same study, something rarely seen in prior literature. The second was to examine how gender predictions of these measurements of game playing vary across game playing situations. For purposes of this study, game playing situation was defined as each player’s report of a game they liked, a game they disliked, and an imagined game they desired. We specified only guiding research questions rather than hypotheses given the paucity of empirical and theoretical work directly pertinent to our focus. In general, we expected gender differences from past literature to be reconfirmed. But, we expected situation differences as well. And, we expected gender differences to be complicated and mitigated at least partially by situation differences.
RQ1: How do men and women players differ on their game playing gratifications and game feature preferences?
RQ2: How do the three game playing situations differ on the reported game playing gratifications and game feature preferences?
RQ3: To what extent do the player’s gender and the specific game playing situation interact to impact game playing gratifications and game feature preferences?
METHOD
Sample
Students were recruited from communication courses from a large Midwestern university. These volunteers received class credit for taking the survey. Participants were told they need not have any experience playing either video or computer games, resulting in a sample of 320 completed surveys. Of these surveys, only 5.9% indicated they had not played any digital games within the past year. For the analysis presented in this study, only those participants who indicated having played either video or computer games at least once a month for the past year were selected for analysis, resulting in a sample of 213 participants. Dropping the sample size also allowed for greater gender equality, where the resulting sample had 50.7% women and 49.3% men. The average age of these 213 participants was 22, with a range of 18 to 67. The average age when these participants began playing digital games was reported to be 7.5 years old. The most common self-reported ethnicity was Caucasian (83%), with African second (8%) and Asian third (4.7%).

Measurements
Game playing situations. As discussed above, there were three game playing situations participants were asked to consider when evaluating their game playing gratifications and game feature preferences. These game playing situations could involve games they were currently playing or had played at some time in the past, and could be either a computer or video game. The first game playing situation asked participants to recall a game they really liked playing, defined here as Liked Game. The second game playing situation asked participants to recall a game they really did not like playing, defined here as Disliked Game. The final game playing situation was imagined, asking participants to think about a game they wished someone would design for them to play, defined here as Desired Game.
Game playing gratifications and game feature preferences. The 7 categories of game playing gratifications involved 21 sub-measures (scale items as arrayed in Table 1), and the 7 categories of game feature preferences involved 19 sub-measures (scale items as arrayed in Table 2). In data collection, respondents were asked to rate each of their game playing situations of the 40 sub-measures as to how good the item was in relation to the game they were recalling for that game playing situation. They rated each item on a scale of 1 to 7, where 1 was “very bad”, 4 was “neutral”, and 7 was “very good.”
No factor analysis was conducted to statistically validate the grouping of these sub-measures into their intended categories. We purposively chose a conceptual application of the scale items to the categories as they were gleaned from the literature review. The reason for this was that while examining the statistical interactions within and between the two clusters is clearly an important future purpose, we wanted to stay as close as possible to the extant literature and set up a study where we could first examine the two clusters working in tandem prior to moving to statistical combinations that would be less easily compared with the available literature. The scale items intended to measure each category did show strong validity as the range of internal consistency reliabilities, shown by their Cronbach’s alpha, were all between 0.85 and 0.95, with only three lower than 0.90.
For our analyses, the scale items as arrayed in Table 1 and Table 2, were averaged for their respective category within each of the game playing situations. For example, the two items for Fantasy were averaged together separately for each of the three game playing situations, providing three variables for analysis purposes, i.e. a fantasy score for each of the three situations. Thus for statistical analysis we were using as our criterion 7 game playing gratifications and 7 game feature preferences
Procedure
Participants were recruited from their classes, and all arrangements were handled via email for participants to gain access to the online survey. The survey was conducted using the website SurveyMonkey.com, an online survey provider. Because the survey was housed with an online provider, participants were allowed to take the survey from any computer they desired. After students indicated their interest in taking the survey and returned a signed consent form, they were assigned an ID number and given the URL to access the survey. All IP address information was removed from the collected database, and ID numbers were only assigned to ensure that students would receive their class credit for completing the survey.
Analysis
As one of our predictors in this analysis was the comparison of different game playing situations within the same participant’s experience, our main statistical test relied on a repeated measures ANOVA. Gender of the player was treated as a between-subject variable, and the three game playing situations were entered as the within-subject variable. From this test we were able to determine the main effects for both gender and game playing situation, as well as the interaction of gender and game playing situation. Main effects for game playing situation were examined using paired t-tests. Interactions effects were investigated in two directions. First, within either gender, paired t-tests were employed to see how the game playing situations varied amongst women and amongst men. Second, within game playing situations, ANOVAs were conducted to investigate the extent to which men and women differed given a specific game playing situation.
RESULTS
Game playing gratifications.
The results for the repeated measures on the game playing gratifications can be found in Table 3. Each part of this analysis will be discussed briefly here, but readers are encouraged to study Table 3 for exact information about each game playing gratification.
Gender differences. Across all three game playing situations, gender differences were significant at p<.05 or greater for all 7 game playing gratifications. Men consistently evaluated these measurements as being better than women did. This is consistent with previous research showing that men are overall more favorable towards digital games. However, when these game playing gratifications were tested within each of the three game playing situations, the overall difference was no longer consistent. As seen in Table 5, while the overall difference held for the Liked Game, women closed the gap for the other two situations. In fact, for Disliked Game, there were no significant differences between men and women on their evaluations as to how well the game gratified Socializing, Mood Management, and Diversion. When evaluating the measurements for the Desired Game, there was no gender difference again on Socializing.
Game playing situation. Comparing the evaluations of the game playing gratifications for each game playing situation, there was another consistent pattern that had only one deviation, as seen in Table 3. Across 6 of the 7 (85.7%) game playing gratifications, players’ evaluations of these measures were highest in the Desired Game and lowest in the Disliked Game, with Liked Game in the middle. Only Diversion had a different pattern, with Desired Game and Liked Game not significantly different from each other, but both were significantly higher than the evaluations in Disliked Game.
Gender by situation. Finally, the repeated measures calculated the interaction of player’s gender and game playing situation as an influence on the players’ evaluations of the game playing gratifications. All significant interactions are plotted in Figure 1. Only two game playing gratifications did not have a significant interaction: Solitude and Diversion. To explore the significant interactions of the remaining 5 measures, a series of paired t-tests were conducted to compare game playing situations within each gender. These results are depicted in Table 3. These paired t-tests indicated that overall the game playing situation differences across men found 4 of 7 (51.7%) game playing gratifications had no differences in rating between Liked and Desired Games. Whereas for women, 6 of the 7 (85.7%) game playing gratifications had the ratings for Desired Games as the highest of all three.
(The solid line is Liked; the dotted line is Disliked; the dashed line is Desired.)


This significant finding highlighted theoverall tendency, shown in the interaction plots in Figure 1, for men to rate all game playing gratifications similarly for both Liked and Desired Games, leaving Disliked Games alone with lower ratings. However, as seen in the plots, this pattern was the opposite for women for all game playing gratifications except Diversion. For women, their evaluations were more similar for Liked and Disliked Games, which were both lower than their evaluations for Desired Games.
Game feature preferences.
The results for the repeated measures on the game playing gratifications can be found in Table 4. Each part of this analysis will be discussed briefly here, but readers are encouraged to study Table 4 for exact information about each game playing gratification.
Gender differences. As with the game playing gratifications, across all three game playing situations, gender differences were significant at p<.05 or greater for all 7 game feature preferences. Again, men consistently evaluated game features as being better than women did. However, when these game feature preferences were tested within each of the three game playing situations, the overall difference was no longer consistent, in ways similar to the results for game playing gratifications. As seen in Table 6, while the overall difference held for the Liked Game, women again closed the gap for the other two situations. In fact, for Disliked Game, there were no significant differences between men and women on their evaluations as to their preferences for Complexity and Curiosity. When evaluating the game features for the Desired Game, there was no gender difference on Characters.
Game playing situation. Comparing the evaluations of the game playing gratifications for each game playing situation, there was another consistent pattern, as seen in Table 4, which mirrored the pattern found for the game playing gratifications. Across all game feature preferences, players’ evaluations of these measures were highest in the Desired Game and lowest in the Disliked Game, with Liked Game in the middle.
Gender by situation. Finally, the repeated measures calculated the interaction of player’s gender and game playing situation as an influence on the players’ evaluations of the game feature preferences. All significant interactions are plotted in Figure 2. Two game feature preferences did not have a significant interaction — Control and Complexity — and a third had only a near-significant trend at p<.10 — Immersion. As with the game playing gratifications, a series of paired t-tests were conduced to compare game playing situations within each gender, and these results are depicted in Table 4. These paired t-tests indicated that overall the game playing situation differences held across both genders, where Desired head the highest ratings overall.
(The solid line is Liked; the dotted line is Disliked; the dashed line is Desired.)
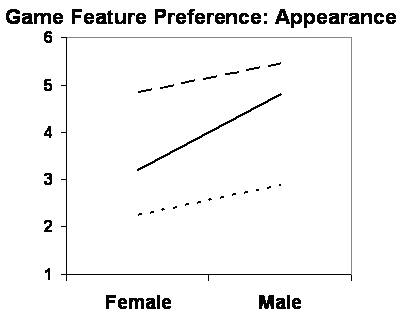

However, as with the game playing gratifications, the interaction plots showed gender variations within situations. That is, the pattern seen in the interactions for the game playing gratifications can also be clearly seen in the 5 significant interactions for the game feature preferences. As shown in the interaction plots in Figure 2, men rated these game feature preferences similarly for both Liked and Desired Games, leaving Disliked Games alone with lower ratings. However, this pattern was the opposite for women for the same measurements. For women, their evaluations were more similar for Liked and Disliked Games, which were both lower than their evaluations for Desired Games. Thus, the same pattern seen for game playing gratifications was found for game feature preferences. While for men their Liked Game evaluations were closer to their Desired Game evaluations, for women, their Liked Game evaluations were closer to their Disliked Game evaluations.

Leave a comment