
As discussed in the previous post Gendering Robots 2006 Research Proposal, I have been thinking about doing research on how people make sense of the gendered nature of robots, AI, and other artificial agents — apparently for longer than I remembered! Here is the method section I wrote over a decade ago for how to do research on this topic.
Interacting with an androgynous computer entity: Impact of gender ambiguity on perceptions and stereotypical categorization.
CarrieLynn Reinhard, The Ohio State University
Research Proposal March 16, 2005
Method Participants
The sample will be composed of 56 men and women from a Midwestern university. The design of this study is a 3×3 interaction, with one factor the gender schema of the perceiver. Thus, this sample will be generated by prescreening a larger pool prior to the actual experiment using Bem’s Sex Role Inventory (BSRI: Bem, 1974) to secure an equal number of masculine, feminine and androgynous individuals.
Stimuli
The other factor in the design is the appearance of the facial stimuli. The faces used in this study will either be pre-existing computer generated photorealistic or humanlike faces found through a data collection of anthropomorphic avatars and agents. Or this type of imagery will be created via a computer program such as Poser Artist©. In either case, any images used will be pilot tested for accurately portraying female, male or gender ambiguous. A gender ambiguous face would combine both masculine and feminine features (Zebrowitz, 1997) in such a matter that neither gender is predominant, while both features are in a ratio that produces uncertainty in how to categorize as categorization could go either way.
Measures
Whenever possible, a phenomenon should be measured in more than one way to increase internal validity and external reliability. For the purpose of this study, there are three main dependent variables to measure: a) the perceived gender of the face; b) the perceived gender stereotypes associated with the face; and, c) the attractiveness of the face as an indicator of willingness to engage with the entity. These three variables will be measured in three ways.
First, using the Social Category Verification Task (SCVT: Zarate & Smith, 1990), in such a way that it is a modified Implicit Association Test (IAT: Greenwald & Banaji, 1995; Greenwald, McGhee & Schwartz, 1998; Aidman & Carroll, 2003), it is hoped that the implicit and thus automatic perceptions and reactions participants will have to these faces can be captured by measuring their response rate when given a matching task. As Zarate and Smith (1990) indicate, their method is designed to measure the dominate categorization an individual will use when perceiving another individual. If a picture and word either clearly matches or does not match for the participant, than the participant would respond quicker than if they are uncertain of the match; in other words, if the match appears ambiguous, the participant will have to do more cognitive processing to determine their response as there is not a dominant or stereotypical response for them to give, and thus there will be a lag in their response time. Thus, response time in this study will be used to compare states where uncertainty or dominant stereotyping was prevalent for the stimuli across the various dependent variables.
However, the participant’s actual responses during this phase of the study will also be recorded to serve as an indication of their choices. These choices will then be compared against the ratings of the images the participants will complete, using the BSRI and other questions to measure the dependent variables. Thus there is a behavioral measure with two components, a response time measure and a recorded first impression choice on their perceptions and reactions to the faces of the entities. Second, there is a self-report questionnaire using scales to add depth and possibly clarification to what was observed in the more automatic appraisals of the faces (see Appendix B for an example).
In addition to these three measures, and demographic and computer use information from the participants, a possible confound will also be recorded. Perceiving an object to be realistic is a psychological confound or intermediary variable studied in media effects research (Potter, 1988). Believing the media is presenting a reality that is plausible, familiar, similar and useful to the viewer will increase how real the characters and world seem as seen through the “magic window” of the television or movie screen. This perception of reality can then impact how persuasive the media is. As these images, created to represent standard computer entities, will be computer generated or even cartoonish, there is the possibility that the participants will not perceive these faces to be realistic. Hence it becomes important to measure how realistic these faces appear to the participant.
Procedure
The procedure will occur in three steps. The first step will be the administration of the BSRI to a large data pool in order to determine the proper distribution of gender schemas needed for this study. This prescreening will be completed at least a week in advance of conducting the actual experiment. Participants will then be brought in under the guise of understanding how they perceive computer entities. After completing a brief questionnaire on their computer use and demographic information, each participant will be shown to a computer where they will perform the modified IAT/SCVT.
Participants will see on one side of the screen a picture, while the other side will have a word said to be related to the picture in some way. Their task is then to indicate on the keyboard “yes” or “no” as to whether or not they believe the image and the word match. The experimenter will indicate that while there is a correct answer for each pairing, the researchers are more interested in how quickly people make decisions after perceiving an image, and thus speed is preferable to accuracy. The first task will consist of seeing pictures of either flowers or insects with the paired words being either “pleasant/unpleasant” (Greenwald et al, 1998). This first task is just to familiarize the participant with the technology.
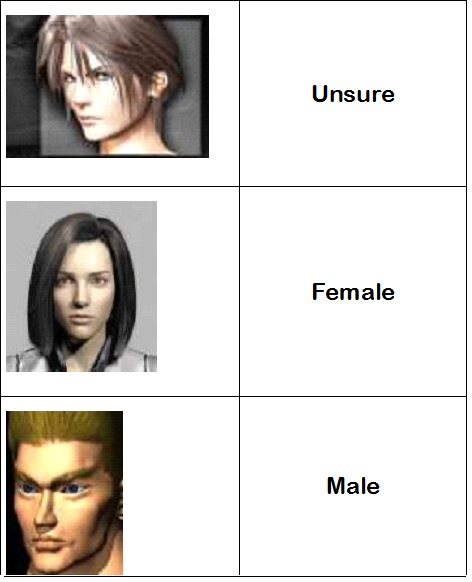
The second test will then show pictures of the faces, with the pairing words being “male/female/unsure” (see Appendix A). “Unsure” is chosen as the “correct” gender label for the ambiguous faces as it is easier to comprehend than the word “ambiguous” given the emphasis on speed, and it still detonates the idea that the gender ambiguous face contains information that could place the face in either the male or female category; thus, “unsure” would be seen as the easier choice if the individual perceives the face as ambiguous. The third test will use the face images, this time pairing them with words representing gender stereotyped occupations and activities, such as “police officer,” “nurse,” “cooking,” “sports.” The final test with the faces would pair them with “pleasant/unpleasant” as an implicit judgment of the attractiveness and likeability of the faces.
After the computer matching tasks are complete, the participants will be shown several gender ambiguous pictures and asked to rate them on using the BSRI scale for gender traits to determine how they perceive the face’s gender, an attractiveness scale, and a realism scale. The faces used in each step of the procedure will be randomly selected from a pool of images in the hope to not repeat faces often, as a means of preventing priming within the experiment. The entire time of the experiment is expected to take no more than 45 to 60 minutes.
References
Aidman, E. & Carroll, S. (2003). Implicit individual differences: Relationships between implicit self-esteem, gender identity and gender attitudes. European Journal of Personality, 17, p. 19-37.
Arkkelin, D. & O’Connor, R. (1992). The “good” professional: Effects of trait-profile gender type, androgyny, and likableness on impressions of incumbents of sex-typed occupations. Sex Roles, 27(9-10), p. 517-531.
Arthur, A. & White, H. (1996). Children’s assignment of gender to animal characters in pictures. Journal of Genetic Psychology, 157(3), p. 297-301.
Bem, S. (1974). The measurement of psychological androgyny. Journal of Consulting and Clinical Psychology, 42(2), p. 155-162.
Bem, S. (1981). Gender schema theory: A cognitive account of sex typing. Psychological Review, 88 (4), p. 354-364.
Colley, A. & Comber, C. (2003). Age and gender differences in computer use and attitudes among secondary school students: What has changed?. Educational Research, 42(2), p. 155-165.
Corneille, O., Brédart, S., Huart, J. & Becquart, E. (2004). When memory shits toward more typical category exemplars: Accentuation effects in the recollection of ethnically ambiguous faces. Journal of Personality and Social Psychology, 86(2), p. 236-250.
Fiske, S. (2004). Social Beings: A core motives approach to social psychology. Hoboken, NJ: Wiley & Sons, Inc.
Goonetilleke, T., Shih, H., On, H. & Fritsch, J. (2001). Effects of training and representational characteristics of icon design. International Journal of Human-Computer Studies, 55(5), p. 741-760.
Greenwald, A. & Banaji, M. (1995). Implicit social cognition: Attitudes, self-esteem, and stereotypes. Psychological Review, 102(1), p. 4-27.
Greenwald, A., McGhee, D. & Schwartz, J. (1998). Measuring individual differences in implicit cognition: The Implicit Association Test. Journal of Personality and Social Psychology, 74(6), p. 1464-1480.
Harper, M. & Schoeman, W. (2003). Influences of gender as a basic-level category in person perception on the gender belief system. Sex Roles, 49(9-10), p. 517-526.
Heilbrun, A. & Schwartz, H. (1982). Sex-differences in level of androgyny. Sex Roles, 8(2), p. 201-214.
Hilgenkamp, K. & Livingston, M. (2002). Tomboys, masculine characteristics, and self-ratings of confidence in career success. Psychological Reports, 90, p. 743-749.
Hodge, B. & Tripp, D. (1986). Children and Television. Oxford: Blackwell.
Jackson, L. (1983). The perception of androgyny and physical attractiveness: Two is better than one. Personality and Social Psychology Bulletin, 9(3), p. 405-413.
Jose, P. & Wong-McCarthy, W. (1983). Gender, androgyny, activity level and talkativeness. Proceedings of the 91st Annual Convention of the American Psychological Association. (18 pages).
Karniol, R., Reichman, S. & Fund, L. (2000). Children’s gender orientation and perception of female, male, and gender-ambiguous animal characters. Sex Roles, 43(5-6), p. 377-393.
Katz, P., Silvern, L. & Coulter, D. (1990). Gender processing and person perception. Social Cognition, 8(2), p. 186-202.
Lee, E. (2003). Effects of “gender” of the computer on information social influence: The moderating role of task type. International Journal of Human-Computer Studies, 58(4), p. 347
Little, A., Penton-Voak, I., Burt, D. & Perrett, D. (2002). “Evolution and individual differences in the perception of attractiveness: How cyclic hormonal changes and self-perceived attractiveness influence female preferences for male faces.” (pp. 59-90). In G. Rhodes & L. Zebrowitz (eds). Facial Attractiveness: Evolution, cognitive, and social perspectives. Westport, CT: Ablex Publishing.
Lobel, T. (1994). Sex typing and the social perception of gender stereotypic and nonstereotypic behavior: The uniqueness of feminine males. Journal of Personality and Social Psychology, 66(2), p. 379-385.
Major, B., Carnevale, P. & Deaux, K. (1981). A different perspective on androgyny: Evaluations of masculine and feminine personality characteristics. Journal of Personality and Social Psychology, 41(5), p. 988-1001.
Martinson, A. (Online). Playing with technology: Designing gender sensitive games to close the gender gap. Indiana University. Retrieved on 1/20/05 from http://www.slis.indiana.edu/research/working-papers/abstracts.html.
Nass, C. & Moon, Y. (2000). Machines and mindlessness: Social responses to computers. Journal of Social Issues, 56(1), p. 81-103.
Nass, C., Moon, Y., & Green, N. (1997). Are computers gender-neutral? Gender stereotypic responses to computers. Journal of Applied Social Psychology, 27, p. 864-876.
Oosterwegal, A., Littleton, K., & Light, P. (2004). Understanding computer-related attitudes through an idiographic analysis of gender- and self-representation. Learning and Instruction, 14(2), p. 215-233.
Parise, S., Kiesler, S., Sproull, L. & Waters, K. (1999). Cooperating with life-like computer agents. Computers in Human Behavior, 15(2), p. 123-142.
Perrett, D., Lee, K., Penton-Voak, I., Rowland, D., Yoshikawa, S., Burt, D., Henzi, S., Castles, D., & Akamatsu, S. (1998). Effects of sexual dimorphism on facial attractiveness. Nature, 394, p. 884-887.
Potter, W. (1988). Perceived reality in television effects research. Journal of Broadcasting and Electronic Media, 32(1), p. 23-41.
Rajecki, D., Graaf-Kaser, R. & Rasmussen, J. (1992). New impressions and more discrimination: Effects of individuation on gender-label stereotypes. Sex Roles, 27(3-4), p. 171
Reeves, B. & Nass, C. (2002). The Media Equation: How people treat computers, television, and new media like real people and places. CSLI Publishing.
Rudman, L. & Fairchild, K. (2004). Reactions to counter-stereotypic behavior: The role of backlash in cultural stereotype maintenance. Journal of Personality and Social Psychology, 87(2), p. 157-176.
Zarate, M. & Smith, E. (1990). Person categorization and stereotyping. Social Cognition, 8(2), p. 161-185.
Zebrowitz, L. (1997). Reading Faces: Window to the soul? Boulder, CO: Westview Press.
Appendix A: Example of Gender Ambiguous SCVT/IAT Test Stimuli
Appendix B: Background Information on Participants Questionnaire
(Pre-Screening Gender Schema Test, modified BSRI, Bem, 1974) Below are questions relating to you on a day-to-day time frame. The items reflect personality traits that you might use to describe how you generally see yourself, and are rated on a 1 to 7 scale, where 1 is “never true” about yourself and 7 is “always true” about yourself. Circle the number for each item you think best reflects you.
1) Leadership
2) Affectionate
3) Aggressive
4) Compassionate
5) Assertive
6) Sensitive
7) Self-reliant
8) Soft-spoken
9) Independent
10) Childlike
11) Warm
12) Forceful
13) Gentle
14) Cheerful
15) Risk-taker
16) Tender
17) Individualistic
18) Sympathetic
19) Self-sufficient
20) Yielding
21) Decision-maker
22) Dominant
23) Ambitious
24) Shy
25) Analytical
26) Athletic
27) Understanding
28) Rigid
29) Gullible
30) Loyal
Looking at the image in front of you, please rate it using the traits below on a 1 to 7 scale, where 1 is “never true” about yourself and 7 is “always true” about yourself. Circle the number for each item you think best reflects the image.
(1-30 are Gender Schema, 31-33 are Perceived Realism, 34-36 are Attractive)
1) Leadership
2) Affectionate
3) Aggressive
4) Compassionate
5) Assertive
6) Sensitive
7) Self-reliant
8) Soft-spoken
9) Independent
10) Childlike
11) Warm
12) Forceful
13) Gentle
14) Cheerful
15) Risk taker
16) Tender
17) Individualistic
18) Sympathetic
19) Self-sufficient
20) Yielding
21) Decision-maker
22) Dominant
23) Ambitious
24) Shy
25) Analytical
26) Athletic
27) Understanding
28) Rigid
29) Gullible
30) Loyal
31) Realistic
32) Common
33) Everyday
34) Likeable
35) Attractive
36) Appealing
Demographics
- My gender is:
- My ethnicity is:
- My age is:
- In an average week:
- How many hours per day do you watch TV?
- How many hours do you listen to music?
- How many hours do you spend on the Internet talking to friends?
- How many hours do you spend on the Internet going to websites?
- How many hours do you spend playing computer/video games? __________
Answer the following questions using the 7-point scale, where 1 is not at all and 7 is very much so.
- I am knowledgeable about computers.
- I am knowledgeable about animation.
- I design computer graphics/animation.
- I am comfortable with computers.
- I like to watch animation.

Leave a comment